Research on designing meaningful interaction with Mental Workload Data
Graduation Thesis
2023 Aug-2024 Feb
In the near future, we may gain the ability to extract and continuously monitor data from the human brain.
While this possibility is intriguing, it also presents several challenges. As this is a relatively unexplored field, questions remain about how such data can be effectively and appropriately applied.
Role
Literature Research
User Research
Hi-fi Prototype
Deliverables
Qualitative UX Research
Interface Design Suggestions
Background
Mental Workload
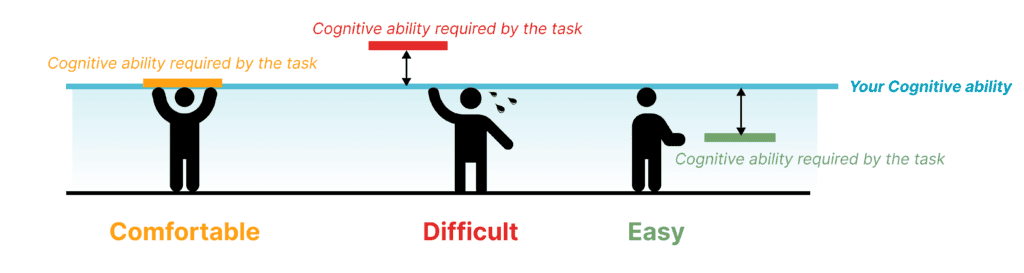
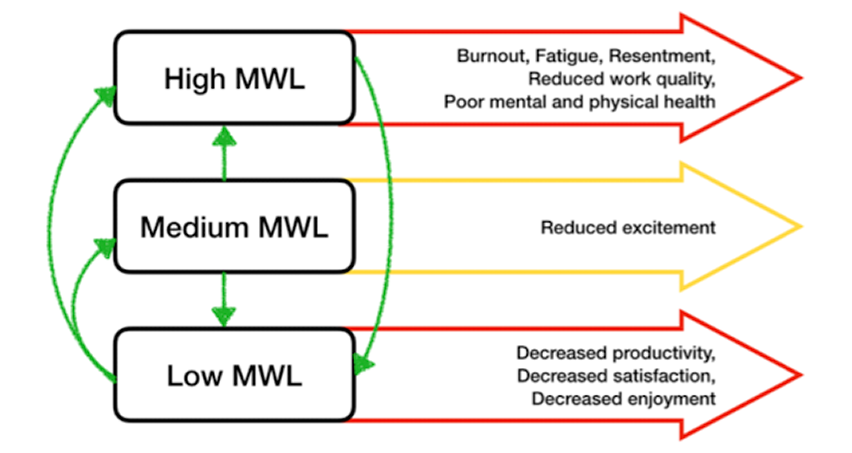
The core concept of this project is “Mental Workload.” It’s defined as the balance between the workload required by the task and the actual effort you used when performing a task. In general, different balances can result in 3 different performances and feelings.
- Easy: Your Cognitive ability > Cognitive ability required by the task
- Comfortable: Your Cognitive ability = Cognitive ability required by the task
- Difficult: Your Cognitive ability < Cognitive ability required by the task
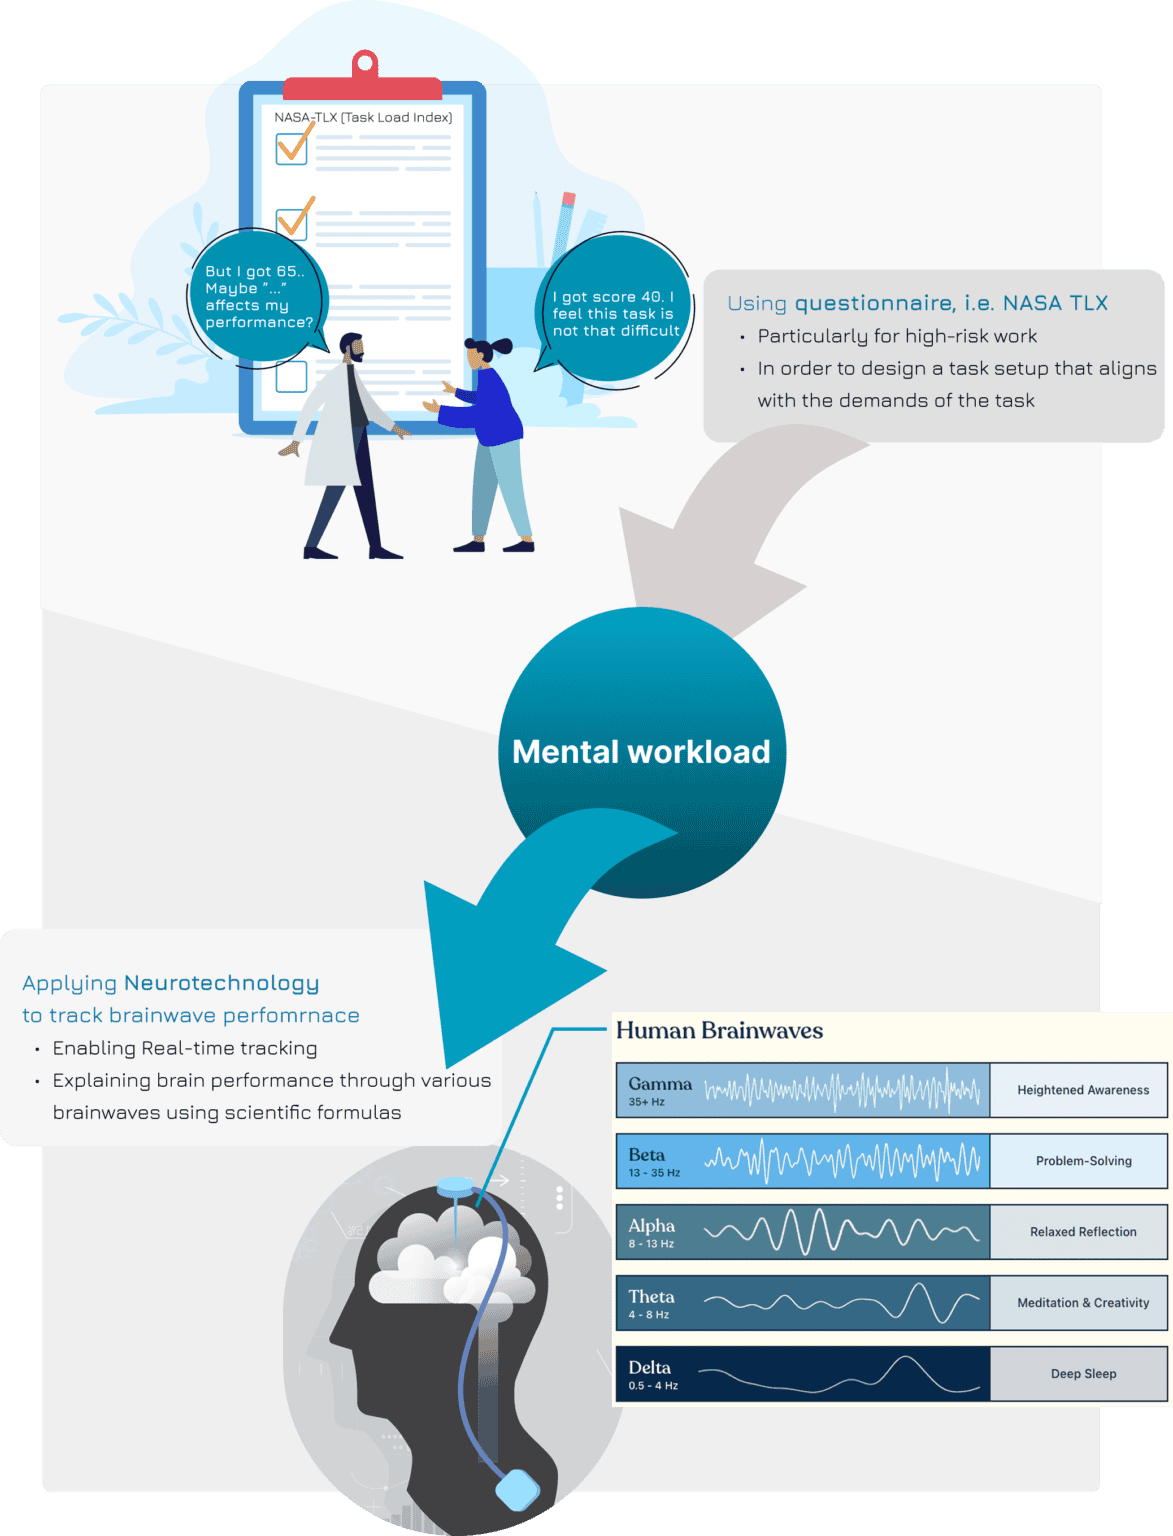
In the past: Measuring it through surveys
In the past, mental workload has been measured to help reduce risks in high-stress jobs, like piloting an airplane. By having participants fill out surveys like NASA-TLX (Task Load Index) or SWAT (Subjective Workload Assessment Technique) while they complete tasks, we can analyze the data to understand how different task processes or environments affect mental workload. This helps in adjusting high-risk tasks to make them safer.
Now: Measuring it through wearing device
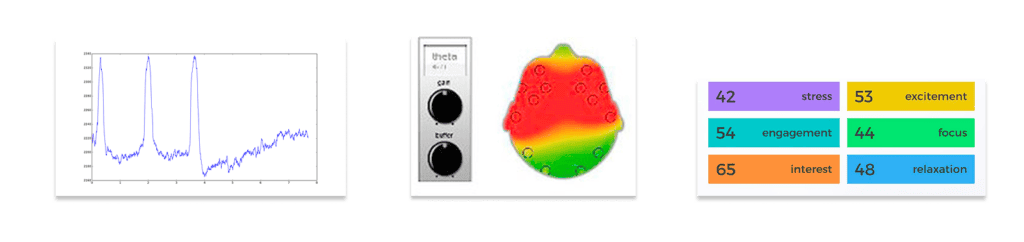
Now, the advance of technology enables us to directly track our brain performance. Through wearing a device that interacts with the nervous system (so called neurotechnology), we can monitor the brainwaves which refers to different brain performance.
There are five types of brainwaves: β, θ, α, δ, and γ brainwaves. These brainwaves coexist in our brains but have different meanings. For instance,
- γ (Gamma) Waves are linked to high-level information processing, cognitive functioning, and learning
- β (Beta) Waves linked to active thinking, focus, and concentration
- α (Alpha) Waves are present during states of relaxation but alertness
- θ (Theta) Waves are associated with drowsiness, daydreaming, and deep relaxation
- δ (Delta) Waves are associated with deep sleep or unconscious states
Research Challenges
Investigating why and how do people make use of their mental workload (MWL) data
Imagine you wear a device all the day to track your cognitive performance, what do you expect to see?
It may sound futuristic, but this technology is already here. In the near future, tracking your brainwaves with wearable devices may be as common as checking your blood pressure. Several products on the market—such as Muse S, NEUROSITY, and EMOTIV—already use EEG (electroencephalography) signals to provide various MWL-related metrics, such as focus level, cognitive workload, and cognitive engagement.
However, as a novel technology and a new approach to measuring cognitive data, there are many research questions that need to be explored before bringing this technology to market.
This research aimed to explore how people perceive this new technology and whether the current design—particularly its reliance on derived metrics—aligns with their actual needs.
Project Limitation
Reference to existing MWL metric design: EMOTIV MN8
As this study does not aim to create a new MWL metric, but to explore how design can support users in reflecting on and resonating with MWL data, in pursuit of practicality, an existing MWL measurement product will be selected as the reference of this research in order to support the design of MWL data.
EMOTIV MN8 is a headphone-style brain-machine interface that uses dual-channel EEG technology to monitor brain activity.
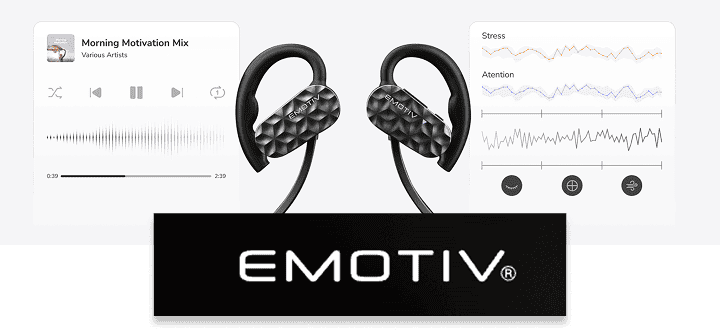
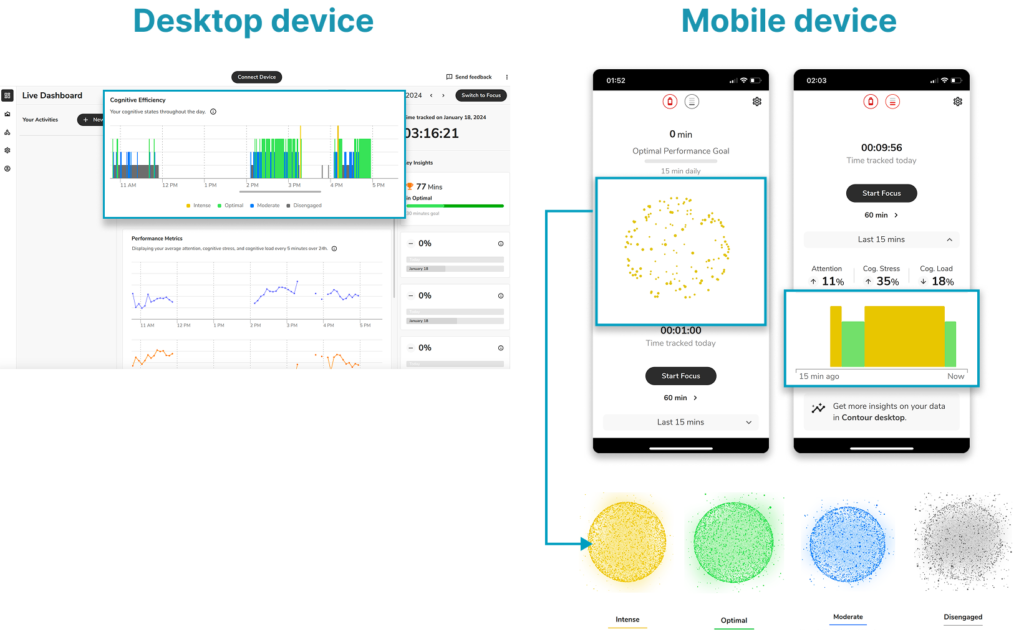
It provides two types of metrics: performance metrics (Attention, Cognitive Load, and Cognitive Stress) and Cognitive Efficiency (Intense, Optimal, Moderate and Disengaged).
Performance metrics
Calculated based on EEG signals
Attention measures how focused a person is during a task.
Cognitive Load reflects how much mental effort is required to complete the task.
- Cognitive Stress indicates the pressure a person feels from that mental effort.
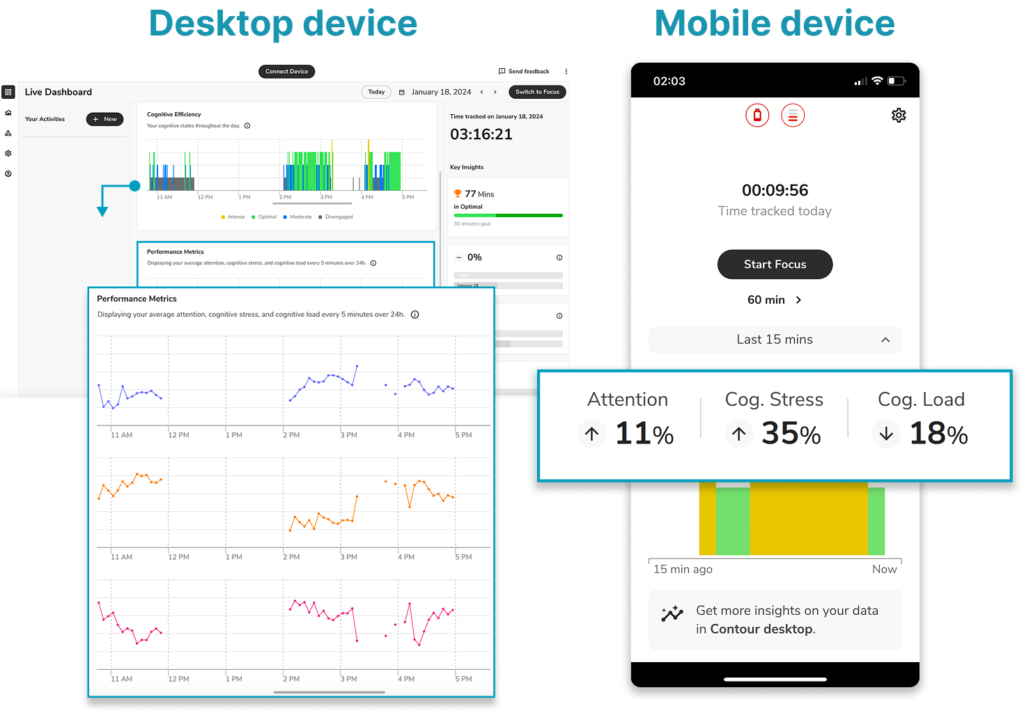
Cognitive efficiency metrics
Derived from performance metrics
- Intense – High stress and overload; prolonged exposure may cause fatigue.
Optimal – Balanced state of stress, load, and attention; ideal for productivity.
Moderate – Fluctuating focus; easily distracted.
Disengaged – Low interest and difficulty staying focused.
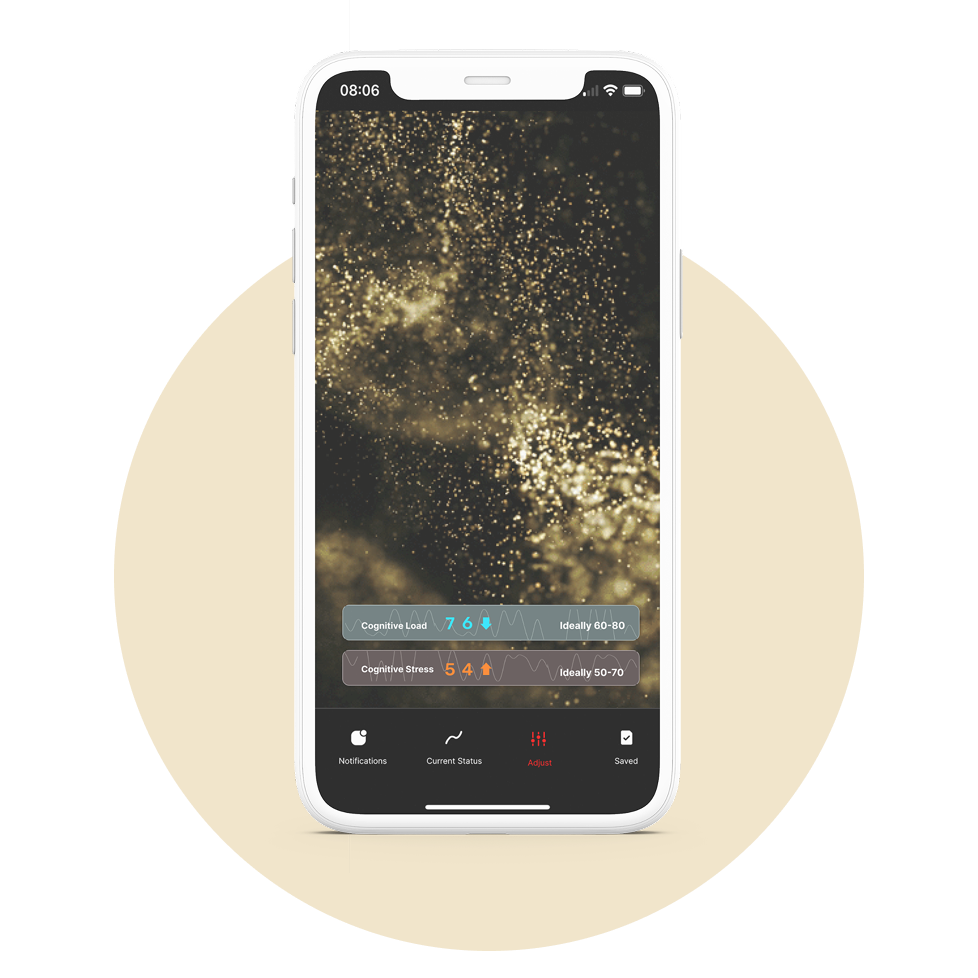
These core metrics are visualized using four colored light spheres on mobile, and bar charts on both mobile and desktop interfaces.
Process and Research Methodologies
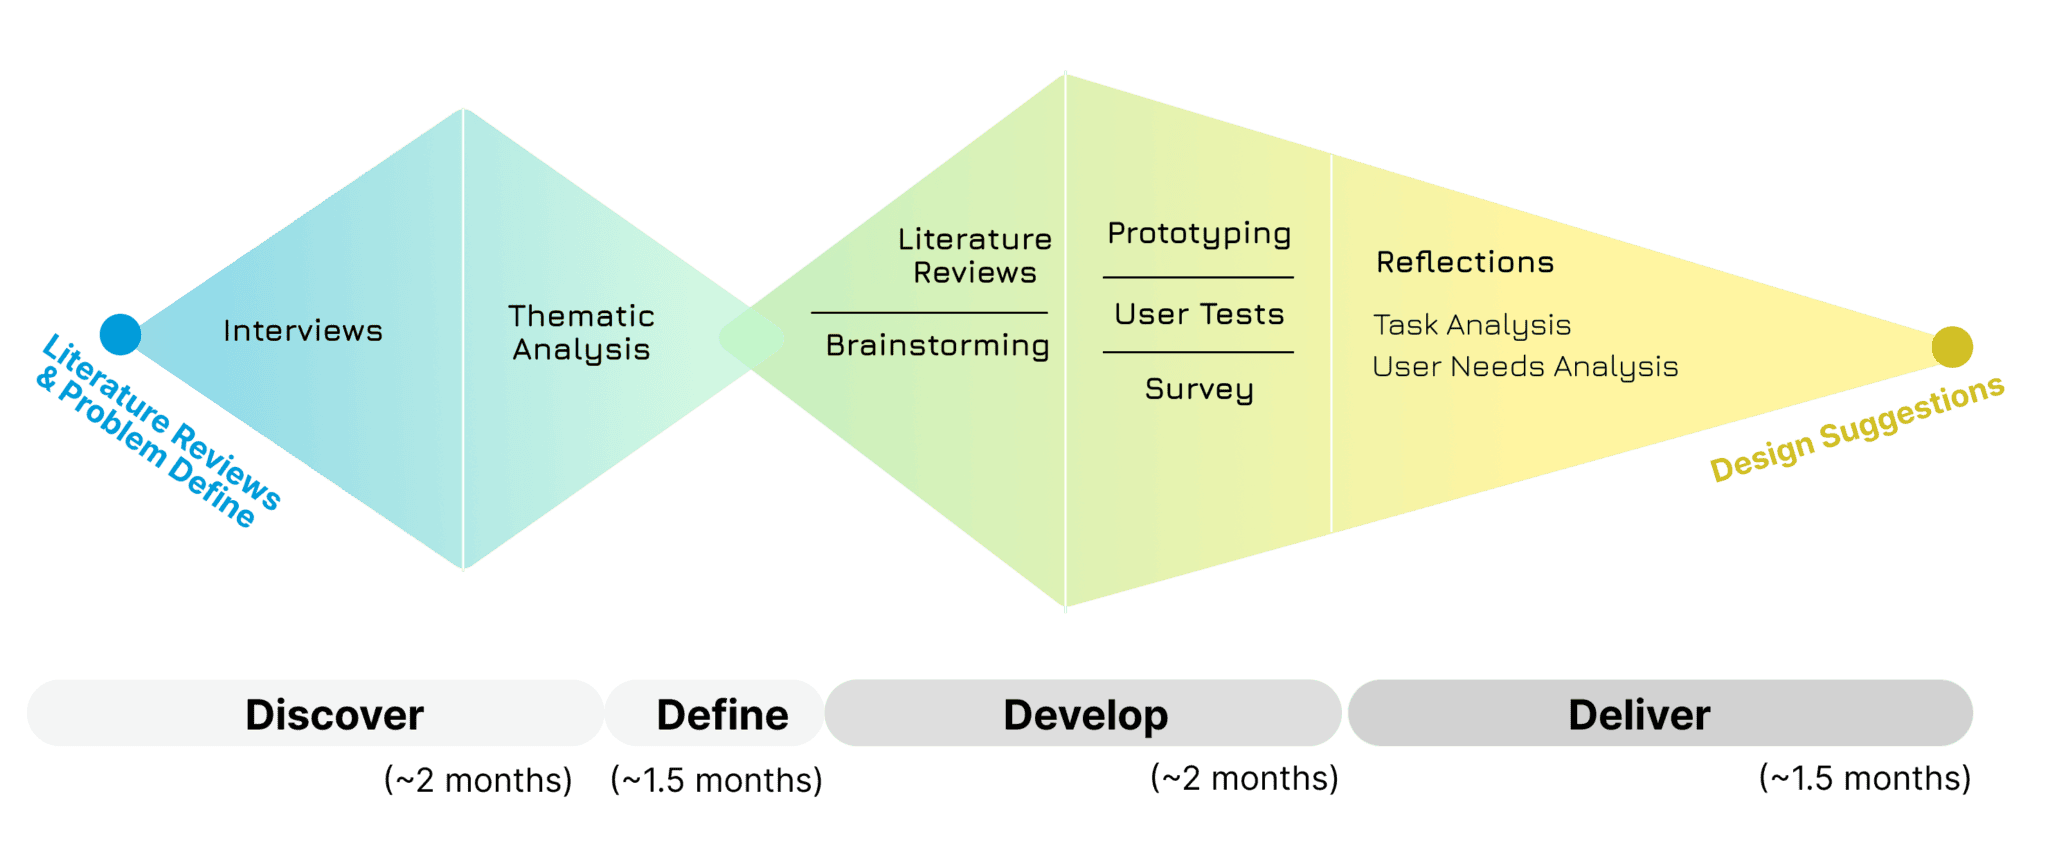
Interviews
To discover user opinions/needs on tracking mental workload
Thematic Analysis
To narrow down user needs into several themes
Co-creative User Tests
To validate research insights by quick design
If you're interested, you can find details about methodologies here
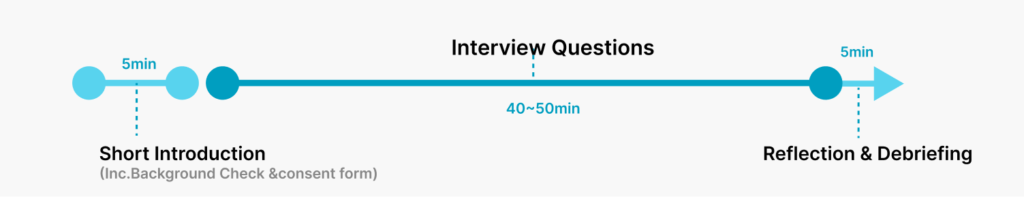
Interviews
Six participants were recruited in total and through snowball sampling. The research didn’t require any specific background as everyone could be the users of Neurotechnology device. Considering diversity of life, values and economic capacity, this research reached out to three students and three non-students.
Thematic Analysis
As this interview was primarily exploring users’ “Attitude” and “Opinions” on MWL, I conducted thematic analysis, which is wildly used to find out people’s views, opinions, knowledge, experiences or values from a set of qualitative data. (Daly et al., 1997).
During the analysis, in-vivo codes would be extracted from interview transcript, and be put into different categories, so called initial categories. Then, initial categories would be clustered to form initial themes. In the end, those initial themes will be refined to generate final themes.

Co-creative User Tests
Ten participants were recruited in total and through snowball sampling in TUDelft campus. As a result, all participants are students background. Similar to interview recruitment, the research didn’t require any specific background as everyone could be the users of Neurotechnology device. In total, there are five males and five females participating in this test, with ages ranging between 20 and 30 years old.
During the test, each participant will be wearing a device that monitors their cognitive data. Simultaneously, they’ll be asked to complete revised TSST test, which take approximately 13 minutes in total. After tasks, interview and card sorting are conducted for around 30 minutes.
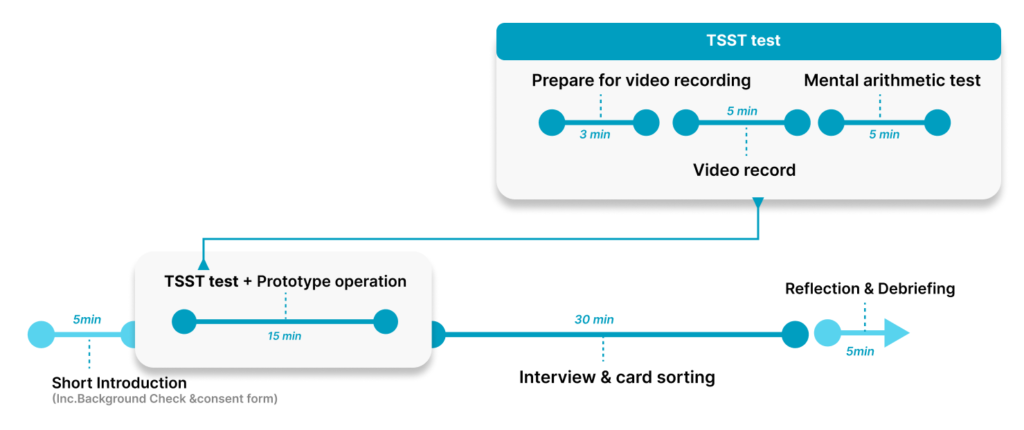
TSST test
Tasks are designed to simulate stressed scenario. Refer the Trier Social Stress Test (TSST test) (Kirschbaum et al., 1993), participants will go through 3 minute preparation (for speech), 5 minute speech and 5 minute mental arithmetic to induce stress. The primary purpose of these tasks is to induce stress changes in users while they are using cognitive data, instead of focusing on users’ physiological responses under stress. To make the scenario more lifelike, the second task is adjusted to record an motivation video for a job application. Compared to the original TSST test experimental design, this study gives participants more control over the process.
Semi-structured interview
After tasks, one-to-one on-site semi-structured interviews are conducted. The discussion involves their experiences of wearing the device for the first time, the timing of using the data, and their understanding of the current design.
Card sorting
After interviews, card sorting method was used to understand how users perceived the existing functions within the app and what they deemed to be priority functions. Participants were given a predetermined set of categories: must-have, nice-to-have and unnecessary. They were asked to organize different features into these categories based on their expereience.
Discover
Understanding how users interpret MWL data
Adopt interview framework based on the Personal Informatics Model
To widely explore user opinions of self-tracking mental workload, I formed a semi-structure interview script according to Li et al. (2010)’s self-tracking personal informatics theory. Five stages includes Preparation, collection, integration, reflection and action. During this exploratory interview, I focus on exploring preparation, integration, and reflection stages.

Preparation: Explore whether users understand what they are tracking and why they do so
- What does mental/cognition load mean for you?
- Can give me 2-3 examples of the moment you feel you are in high or low MWL?
- What can be your goal to track your mental/cognitive health condition?
Integration: Explore how users interpret different forms of mental workload data
- What attracts you most? why?
- How will you explain this picture?
- What do you think is missing? why?
Reflection: Explore how users evaluate and relate MWL to their lives
- What do you think a good or bad cognitive/mental condition means?
- What are things worth tracking in your life?
- Do you think your life is static or varied? Which do you prefer?
- How often do you reflect on your mental / cognitive health – and why?
Consolidate into four main themes
Theme 1: Over-simplified notions of MWL prevent users from setting meaningful or reflective goals
Participants often equated MWL with stress and only mentioned peak work or emotional moments when talking about it. This narrow view limited their expectations and made it harder to engage with MWL tracking in a meaningful way. Most also didn’t know how to describe what an “ideal” or “low” mental workload should feel like.
- 5/6 associate mental workload (MWL) with stress or use stress to explain high levels of MWL.
- 3/6 were unable to articulate their ideal MWL, and 3/6 were unsure how to define or illustrate a low MWL.
- 6/6 mentioned their busiest (6/6), most productive (2/6), or emotionally intense (2/6) times to describe high MWL or MWL track-worthy moments.
Theme 2: Users felt disconnected from the cognitive data
Interestingly, most people see themselves as the experts of their own brain, which makes it difficult for cognitive data products to gain interest. When discussing motivations for tracking mental workload (MWL), participants mainly wanted to validate their brain responses and, if possible, identify sources of stress. However, many expressed skepticism, doubting that the data would provide new insights or drive meaningful actions.
- 4/6 users hold negative attitudes toward tracking MWL, mainly because they do not expect MWL data can provide insightful insights.
- 3/6 feel indifferent toward cognitive data.
- 2/6 mentioned their cognitive state was fine and saw no need to act on the MWL data
- 4/6 said their primary MWL Tracking motivations are verifying brain reactions and understanding the causes of stress.
Theme 3: Many doubts were raised about the accuracy of mental workload data
The term accuracy consistently came up across participants’ feedback. Among all concerns, the most frequently questioned aspect was how a single mental state is defined using cognitive data. Unlike physiological data, which often has objective benchmarks, cognitive data lacks a clear standard for interpretation. This ambiguity made participants skeptical about the reliability of such measurements.
2/6 questioned the accuracy of measuring Mental workload
4/6 questioned whether cognitive data reflects real-life experiences.
4/6 doubted the accuracy of defining a mental state through MWL data.
5/6 were skeptical about distinguishing between two mental states using the MWL data.
Theme 4: Cognitive Data Is for Reflection, Not Real-Time Use
Most participants found MWL data more useful after a task than during it. They expected it could confirm cognitive states, uncover issues, or offer suggestions — but few could clearly articulate what those suggestions or issues might be. For most, MWL data functioned more as a tool for recording and confirming experiences than for prompting real-time action.
- 4/6 participants saw MWL tracking as a way to confirm if they had reached an ideal cognitive state, like staying focused.
- 4/6 thought it could reveal unnoticed cognitive issues.
- 4/6 expected the data to offer actionable suggestions.
- 4/6 were interested in seeing how the data relates to their actual experiences.
- 6/6 expected that reflection moments should happen after completing a task or after returning home.
- 2/6 felt that checking MWL data during a task was unhelpful and could even increase stress.
Main Insights: Unclear Impact and Low Trust Kill Motivation
For most users, the idea of tracking cognitive data feels distant. They’re unsure what the data really tells them or why it matters. Since it feels more subjective than things like heart rate or steps, they also tend to trust it less. All of this makes them less motivated to track it.
Define Design Goal
Turn abstract MWL data into something users could RESONATE with — by Amplifying the Meaning and Trustworthiness of MWL Data
Develop
Start from two main concepts
Enhancing the Clarity of Cognitive Data
What meaningful insights can MWL tracking provide?
Show MWL as a balance of cognitive resources, where stress reflects imbalance
Highlight the importance of 'state transitions' and 'reaching desired states'
Literature reference
While users often equate MWL—especially high MWL—with stress, theories suggest otherwise. According to Lazarus et al.(1984) and Gaillard (1993), stress is better understood as a reaction to insufficient cognitive resources, not simply high workload.
Fostering User trust with Cognitive Data
How can we make MWL data more reliable?
Design richer interactions to show how data connects to each metric
Increase transparency in how MWL metrics are generated
Literature reference
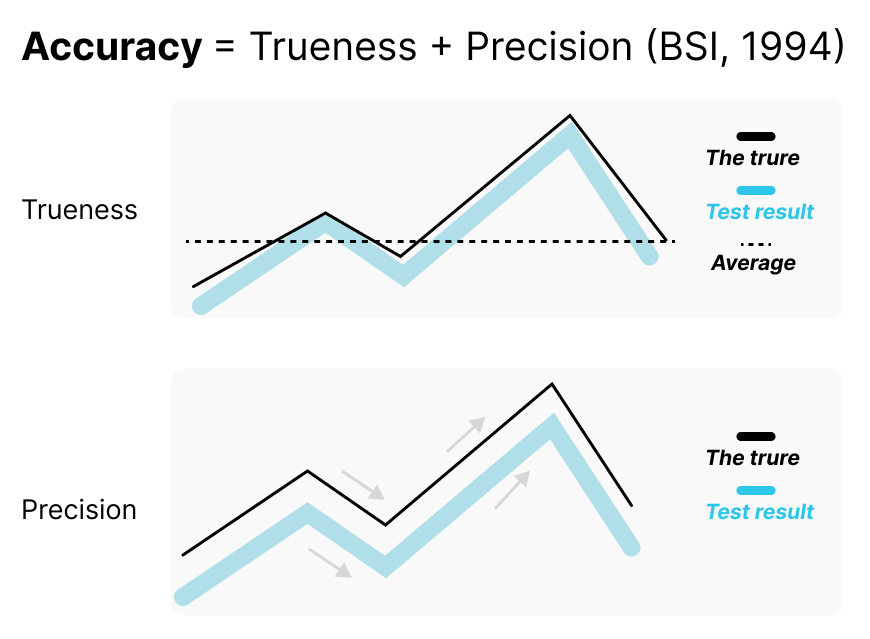
Many users question the “accuracy” of cognitive metrics. According to BSI (1994), accuracy includes trueness (how close data is to a reference), and precision (how consistent the results are).
In cognitive metrics, it’s difficult to fully control for both trueness and precision, especially when the true cognitive state is not objectively measurable. However, we can still improve users’ trust by showing what kind of reference values or baselines the data is derived from—emphasizing transparency of trueness.
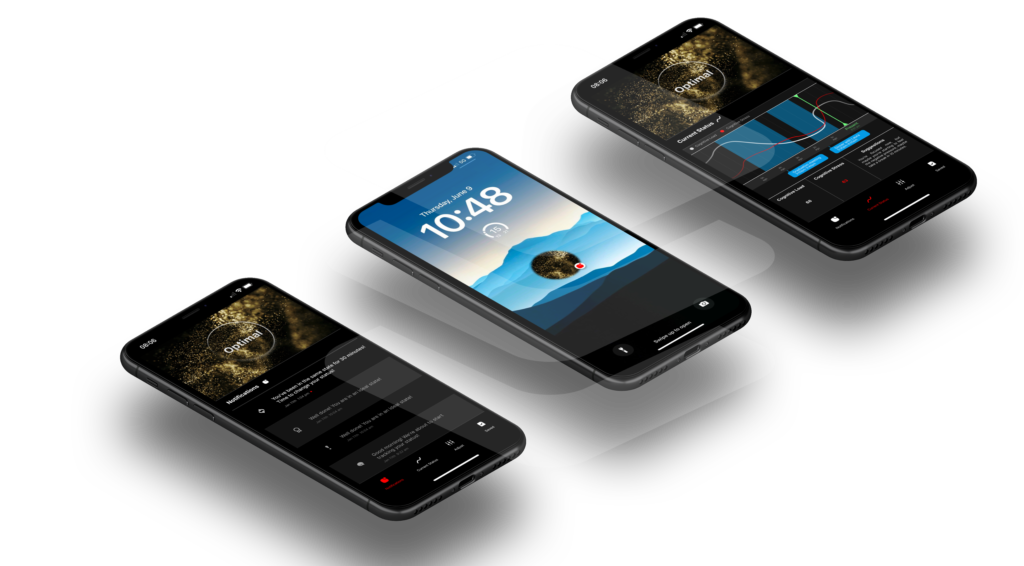
The four key interfaces of the prototype
My design explores several experimental ideas across four main pages—Status Curve, Notifications, Adjust, and Saved. Each page tests different concepts inspired by interview insights and literatures and served as a discussion tool during user testing.
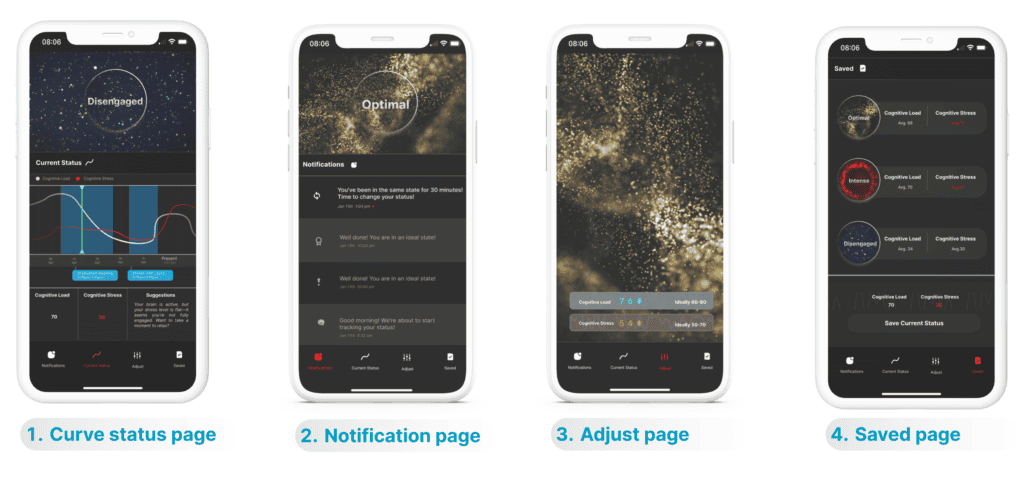
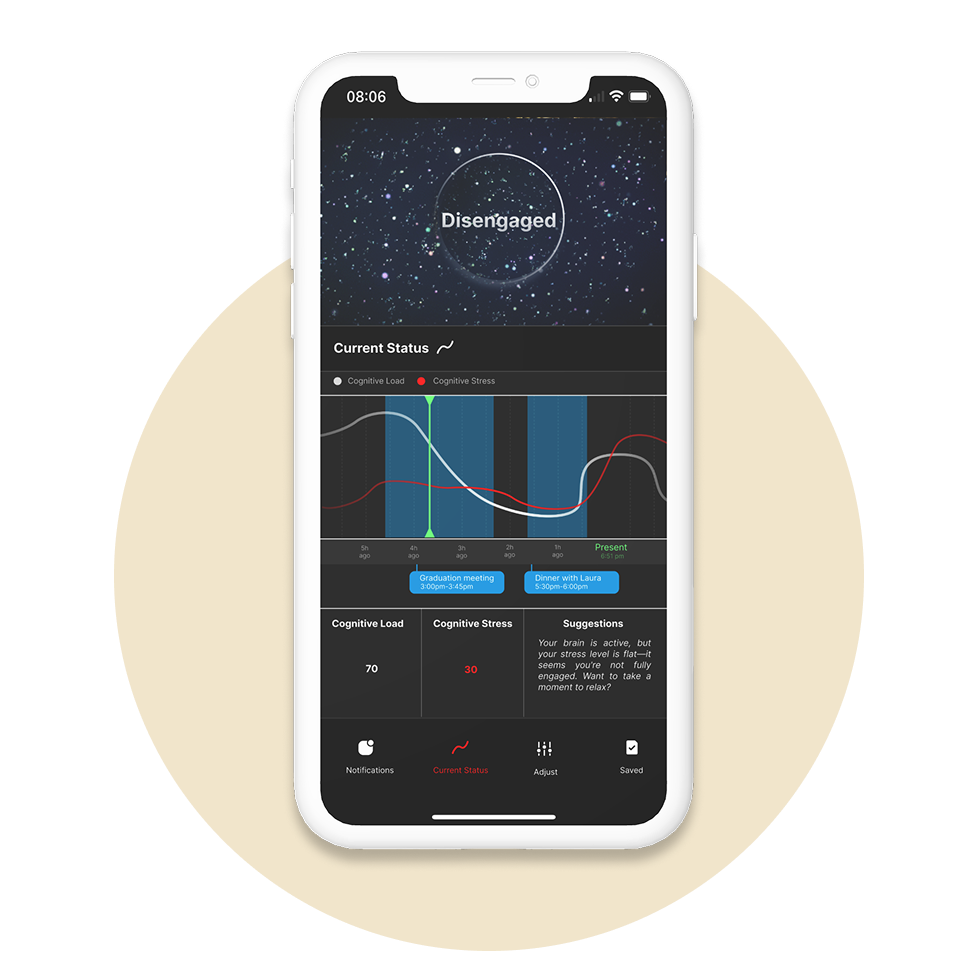
Curve status page
This page is designed to show detailed MWL data. In my design, I focused on how to present metrics in a way that encourages user understanding and reflection.
Redesign metric display: medium level of metric abstraction
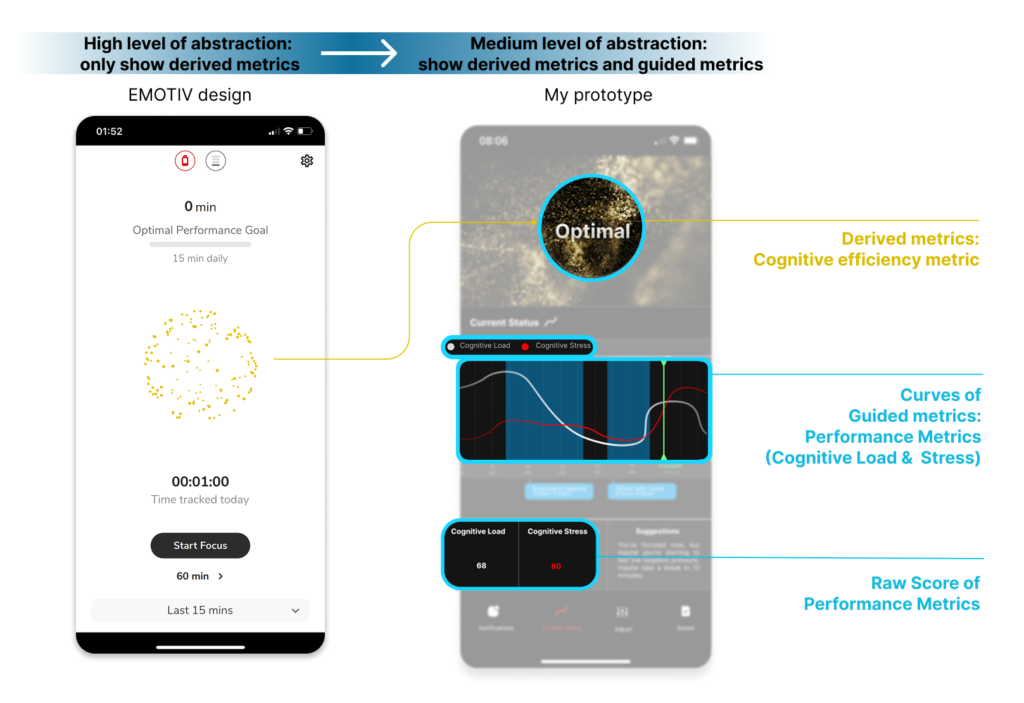
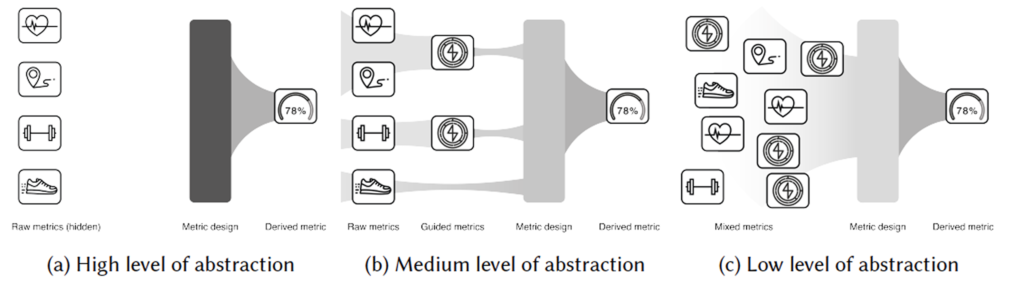
I referred to Bentvelzen et al. (2023) and their concept of abstraction levels. Research shows that the medium level is most effective for prompting user reflection.
For example, in sleep data:
Raw metric: heart rate
Guided metric: number of awakenings
Derived metric: sleep quality
The theory divides data abstraction into three levels:
Low: includes all three (raw, guided, derived)
Medium: guided + derived
High: only derived
Then, I applied this to mental workload metrics, combining guided and derived metrics to support user reflection
Raw metric: EEG signals
Guided metric: performance metrics- Cognitive load, Cognitive stress
Derived metric: cognitive efficiency metrics- Intense, Optimal, Moderate, Disengaged
Show continuous curved instead of only number
To show the balance of cognitive resources, I used two continuous curves for comparison. Curves, rather than numbers, help users reflect more intuitively on changes over time. By presenting them alongside the derived metric, users can better understand their cognitive state and why a certain cognitive efficiency metric was given.
Provide Suggestions
Based on early user research, I offered explanations and suggestions tailored to different metric states—especially to help users know when it’s time to switch activities to avoid fatigue.
Connect to calendar events
This feature is designed to strengthen the connection between data and real-life events, allowing users to interpret metrics within their daily context rather than as isolated numbers.
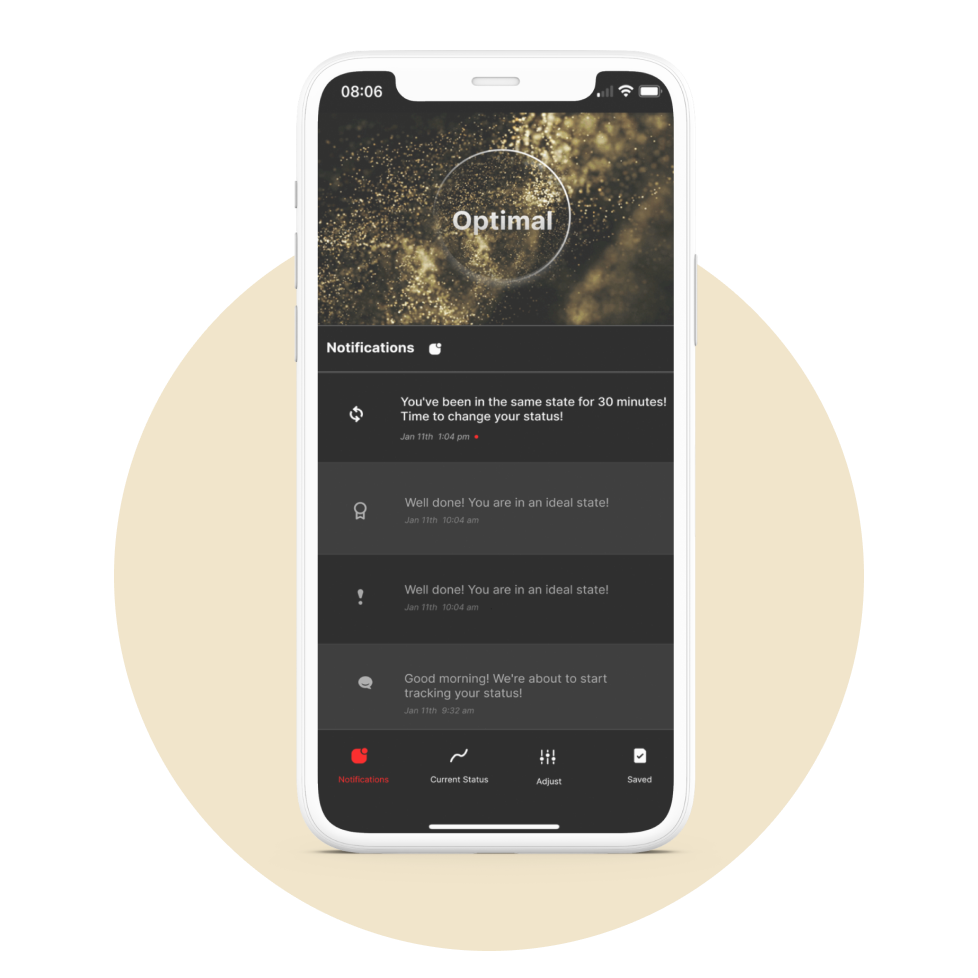
Notification page
Lock Screen Widget for Real-Time Status Monitoring
In early research, I found that users didn’t want to see much cognitive information in the moment, as it could be distracting. However, when designing suggestions and prompts, I realized that if users don’t notice them right away, they may lose their value. So I designed a lock screen widget to show minimal, essential information—just enough to alert users when something needs their attention.
State-Switch Notifications
Based on the literature, I learned that MWL data isn’t about judging whether your cognitive state is good or bad, but about recognizing whether the user has entered an ideal state—or stayed in the same state for too long. So I designed the notifications to reflect these two points.
Adjust page
Adjust page is designed to demonstrate MWL data in a different way. It presents MWL data in a more dynamic and engaging way and incorporates simple interactions to help users connect with the data and gradually shift their cognitive state.
Use dynamic visuals, natural metaphors, and subtle interactions to convey various MWL metrics
Compared to presenting cognitive derived metrics as plain text—which often lacks emotional resonance—I explored ways to make such data feel more meaningful to users. Inspired by the concept of calm technology (Weiser & Brown, 1996), ambient information design uses subtle, non-intrusive visuals to reduce cognitive load and support smoother tech adoption (Ishii & Ullmer, 1997; Chatzitsakyris et al., 2004).
First, I aim to help users better perceive the relationship between guided metric changes and background derived metrics.
Dynamic visuals and natural metaphors—such as flames for overload and drifting stars for underuse—are used to intuitively represent mental workload.
Animated number transitions further strengthen the connection between quantitative data and background states, making the data feel more alive and interpretable.
Second, I aim to encourage users to linger, reflect on their current state, and gradually shift toward a more balanced one.
Interactive prompts, such as screen tapping, are designed to attract attention and invite light interactions.
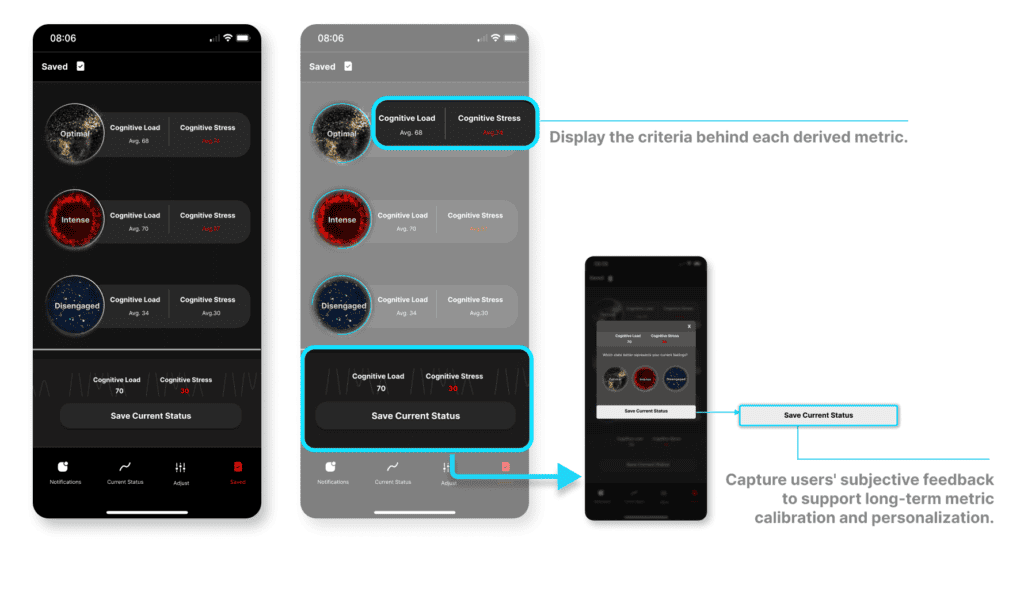
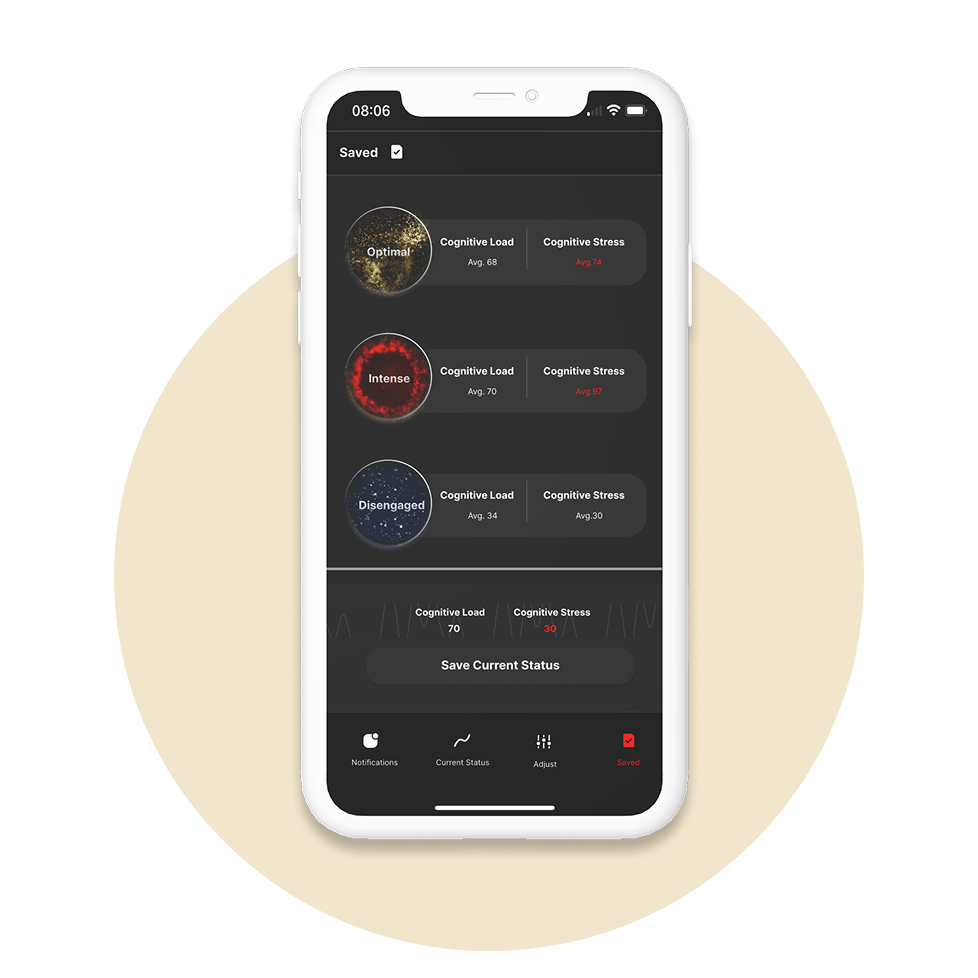
Saved page
The Saved page displays all stored data along with the criteria used for each derived metric.
Enhancing data transparency and enabling subjective calibration
To address concerns from early interviews about the reliability of cognitive metrics, I looked beyond data resonance and focused on increasing transparency. Since many participants believed that cognitive states are subjective, I designed a feature that lets users save their current state and record their own judgment. Over time, this subjective input helps the system gradually adjust and personalize the interpretation of metrics, making them more reflective of individual experiences.
Deliver
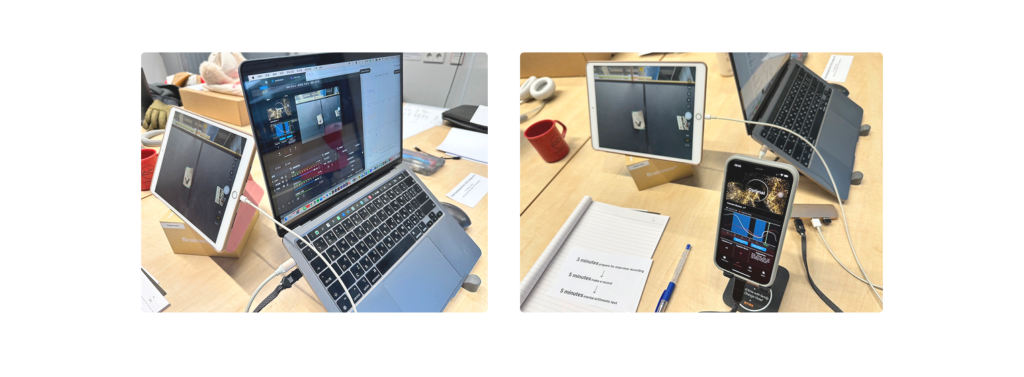
Co-creative User Testing
TSST test + Interview + Card sorting
Since this product idea is still quite new, I conducted a user test with a co-creative nature. I used the prototype I created from earlier research and literature as the main tool in one-on-one sessions with 10 participants. They interacted with it and shared their thoughts throughout the process.
During the test, participants wore an EMOTIV headset and completed a 15-minute Trier Social Stress Test (TSST), which includes things like speaking in front of a camera and solving mental math problems—designed to create a mildly stressful situation. While doing this, they were free to use the prototype whenever they wanted—to check their cognitive state or explore any feature.
What I Focused On During Testing
(Warm-up) First experience of wearing the device
- You’ve been wearing it for nearly 15 minutes. How was your first experience of wearing it?
- Will you want to wear it again in the future? If so, when do you want to wear it? why?
Timing of using the prototype
- Do you remember the moments you checked the app? When was that?
- why do you want to check at that moment?
Functions and priorities
- Have you tried all the functions? Which functions have you tried or have not tried yet?
- Here are some small cards. Please help prioritize them as Must Have, Nice to Have, or Unnecessary. Feel free to add anything you think is missing.
Concept Testing Results
Card Sorting Results:
How Participants Prioritized Design Elements in the Prototype
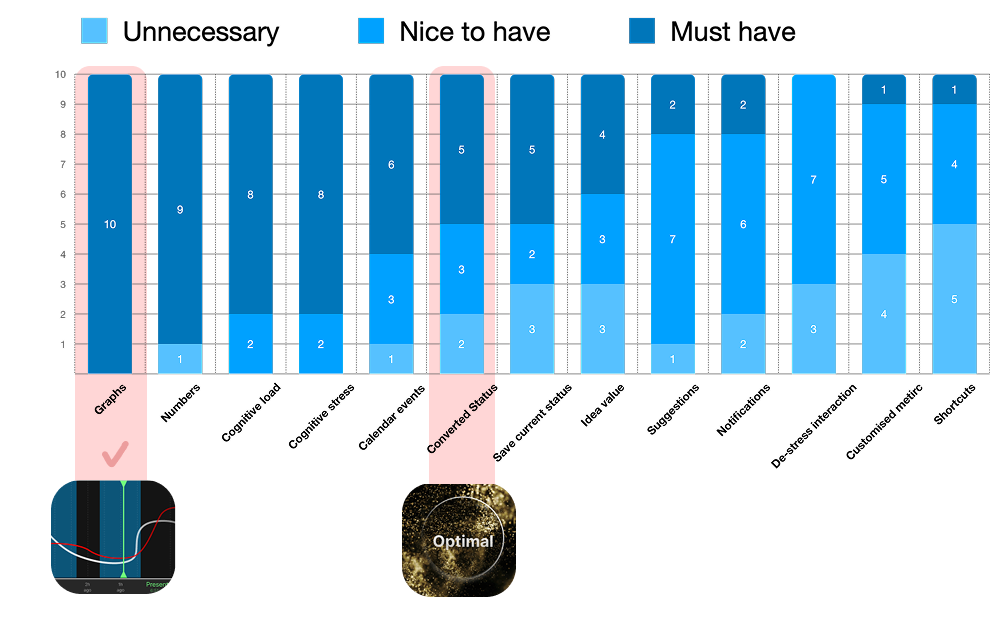
Using multiple curves to present data is popular and successful
Interview and card sorting results revealed that people care more about the meaning behind Cognitive Load and Cognitive Stress, and what insights they can gain when the two are combined, rather than focusing on Cognitive Efficiency Metrics. While users may not immediately understand these terms, once explained, they expressed strong interest and engaged in various discussions about potential applications.
Users don’t want suggestions—especially not notifications or reminders
My design included suggestions for state changes and reminders to reach an “ideal state.” However, users rejected these features, stating that they are not realistic during work and questioned who defines this so-called “ideal.” They emphasized that such advice felt unnecessary and even intrusive.
Dynamic data visuals were seen as unprofessional and redundant
Though a few users appreciated the attention-grabbing nature of dynamic displays, most felt they lacked a direct connection to the metrics, making them even less trustworthy. One participant even mentioned that just seeing the numbers change was already enough to resonate with the data.
Users are uninterested in the criteria used to define metrics and don’t want their own judgments to interfere the criteria
Although there was skepticism around data interpretation and trust, user tests showed that users had little interest in seeing how metrics were calculated or judged. They preferred not to influence the system’s objectivity with their own reasoning.
Extended Discussion
What users want is guidance on how to interpret the data—not what to do
While early interviews led me to believe users were expecting actionable advice, it turns out that when it comes to the brain, people don’t want to be told what to do. Instead, they want more context—different ways to understand their cognitive state, not instructions.
"To be honest, I didn't really get what "Stress" meant at first, but I found it super interesting when you explained it just now. I actually liked it a lot. It just need more explanations"
Participant #1
"I think I need this chart, but mainly because I want to see its explanation. If you just only show me the chart, it feels like I'm writing a paper and have to figure out the insights by myself."
Participant #10
“Record” and “compare cognitive performance” are seen as more practical features
Interestingly, four participants independently expressed that they would find it more valuable to log and compare their performance data. For instance, they were interested in identifying the times of day when they are most productive or tracking their progress on repeated tasks over time.
“What I'm thinking is kind of like....I want to compare the same thing, so I'd only store data related to that specific event.(E9)”
Participant #9
Sensitivity to the Length of the Time Window
Participants expressed a clear preference for a shorter time window when reviewing their current performance. While they appreciated seeing data segmented in hourly units, many found a five-hour span overwhelming. One participant commented that for checking real-time performance, they only wanted to see the past one to two hours, with hourly breakdowns.
"I feel this page... has too much information. I understand that the green line represents my current status, and it shows the pattern from many hour ago. But why...? For real-time checking, I’d prefer the most straightforward results—not something that combines multiple hours of data.”
Participant #3
"I assume I'll be using it most often for work. Personally, I tend to break down my work time into hours because my focus lasts for about an hour at most.
Participant #2
How should cognitive metrics be benchmarked—against the public or the self?
During discussions about metric calibration, participants questioned whether cognitive performance should be measured against a public average (like BMI) or against individual baselines. This may explain why derived metrics were less compelling—they represent a generalized standard that may not feel personally relevant.
"I believe this should be about comparing myself to myself... like, comparing how stressed I feel today to how much less stressed I felt yesterday, instead of comparing my stress level to someone else's."
Participant #10
Users are willing to provide personal context to better understand their cognitive performance
One participant likened this to menstrual tracking apps, suggesting that adding personal notes—such as sleep quality or diet—might enrich the data and help reveal more meaningful patterns for self-reflection.
“I feel like if this app were to give me suggestions, it could be similar to period-tracking apps. They don’t just monitor your cycle—they also let you log your mood and physical reactions each day. Likewise, this app could go beyond simply telling me whether I’m stressed. With some simple input from me, it could give the team more data to analyze my state. A conversational interface could work too. Even a basic Q&A page might help... As you browse, you might think, ‘Oh yeah, that could be something I need to pay attention to.’ It doesn’t need to be super accurate; it just needs to help surface potential issues.”
Participant #5
Design Reflections and Insights
Subjective cognitive data shouldn’t be treated like objective physiological data
Ultimately, I believe this discussion should return to the fundamental differences between physiological and cognitive data. For physiological data, derived metrics can be an effective way to capture patterns and trends in the body. However, when applied to cognitive performance, such metrics often raise questions about what standards they are based on, or make it difficult for people to distinguish between different metrics.
After all, the creation of any “metric” involves the setting of a “standard.” When the data itself is highly subjective or open to interpretation, I remain cautious about whether it is appropriate to convert it into a derived metric.
Still, in conclusion, based on the various suggestions brought up by participants, I believe cognitive data is more suitable for personal exploration of performance patterns, rather than being summarized through adjective-based metrics or compared against general population standards.
Yet derived metrics still serve a purpose
That said, I want to emphasize that derived metrics still have their value. For one, the literature has already raised extensive discussions around the privacy concerns of cognitive data. Some have even suggested that in the future, employers might use cognitive data as part of their hiring criteria. I believe this points to an important issue: once such technology becomes available, we must consider how the data might be used in interpersonal exchanges and social contexts.
Here’s the problem—we probably wouldn’t want others to access overly detailed or intimate aspects of our personal data. In this regard, derived metrics might actually help reduce privacy invasions compared to raw numbers or data curves.
Similarly, when my study participants discussed their results with each other after the sessions, they tended to refer to summary metrics—saying things like “Mine came out as intense, what about yours?”—rather than going into the specifics of their data curves. I think this shows that derived metrics may be more suitable for human-to-human communication, as they preserve a level of abstraction and personal privacy.
Distinguish between two usage scenarios: real-time performance checking and post-task performance comparison
In terms of design, it might be useful to distinguish between two usage scenarios: real-time performance checking and post-task performance comparison. The former is centered around the timeline, while the latter is more focused on events.
When observing and discussing how participants interacted with the prototype, I noticed that although most people checked their data after completing the task, some still chose to view it during the task. The later goals was to confirm whether they were performing well in that very moment.
This led me to a new insight: these two scenarios likely require completely different approaches to display data. Users checking their state in the moment care about their performance over the past 2–3 hours. In contrast, those returning to the data hours or even days after the task may no longer be concerned with the timeline itself. Instead, they might focus on what they were doing during certain periods, or identify which segments of data correspond to similar types of activity.